

Australian home prices fell again in September, while inflation picked up and the RBA raised rates. If you’re trying to buy your first home, that can feel contradictory: the price may be coming down, but the repayment still needs more of your pay.
National dwelling values fell 1.1% in September and were 5.2% below their March 2026 peak. Every capital except Darwin recorded a monthly fall. Buyers may have more room to negotiate, but a lower purchase price does not automatically mean a comfortable loan.
October 2026 at a glance: prices down, rates up
Cotality’s national dwelling index fell 1.1% in September, its sixth consecutive monthly decline. Annual growth was zero. These figures are from Cotality’s 1 October release and describe the national index, not the value of any one home.
Key highlights
The falls have spread. Brisbane fell 1.5% in September, Sydney 1.4%, Adelaide 1.3%, Perth 1.2%, Melbourne 0.7% and Hobart 0.5%. Darwin rose 0.4%. Sydney remained the furthest below its recent peak, down 8.6% from February 2026.
The cash rate is now 4.60%. The RBA announced a 0.25 percentage point increase on 29 September, effective 30 September. It was the fourth increase this year. Your home loan rate is a separate figure, so check your lender’s actual rate and repayments.
Inflation rose again. The ABS August release put annual headline inflation at 4.0%, up from 3.5% in July. Underlying (trimmed mean) inflation, which strips out the biggest price swings, was unchanged at 3.6%. That release came out on 30 September, the day after the RBA decision.
Buyers are facing several pressures at once. CBA attributes the downturn to higher borrowing costs, weaker sentiment, tighter finance and announced housing tax changes. That is its assessment of demand, not a prediction of what a particular seller will accept.
Homes are taking longer to sell. Cotality put combined-capital advertised stock 23.1% above a year earlier, even though new listings were 9.2% lower. The final capital-city auction clearance rate was 46% for the week to 27 September. Those are combined-market figures; check comparable local sales before deciding how much negotiating room you have.
Check your first-home options early. A grant or deposit scheme may help with upfront costs, but it does not replace the lender’s assessment. Use our 5% Deposit Scheme guide and the current program information from Housing Australia before including assistance in your budget.
What this means for buyers
More stock and softer prices can give you time to inspect, compare and negotiate. Higher rates pull the other way by increasing loan costs. I would refresh the finance first, then use recent sales for the exact property type and area you want. A national decline is useful context, but it cannot tell you whether an individual listing is good value.
Sources: Cotality, 1 October 2026; RBA decision, 29 September 2026, effective 30 September; ABS August 2026 CPI, released 30 September.
Why prices are falling and what it means for affordability
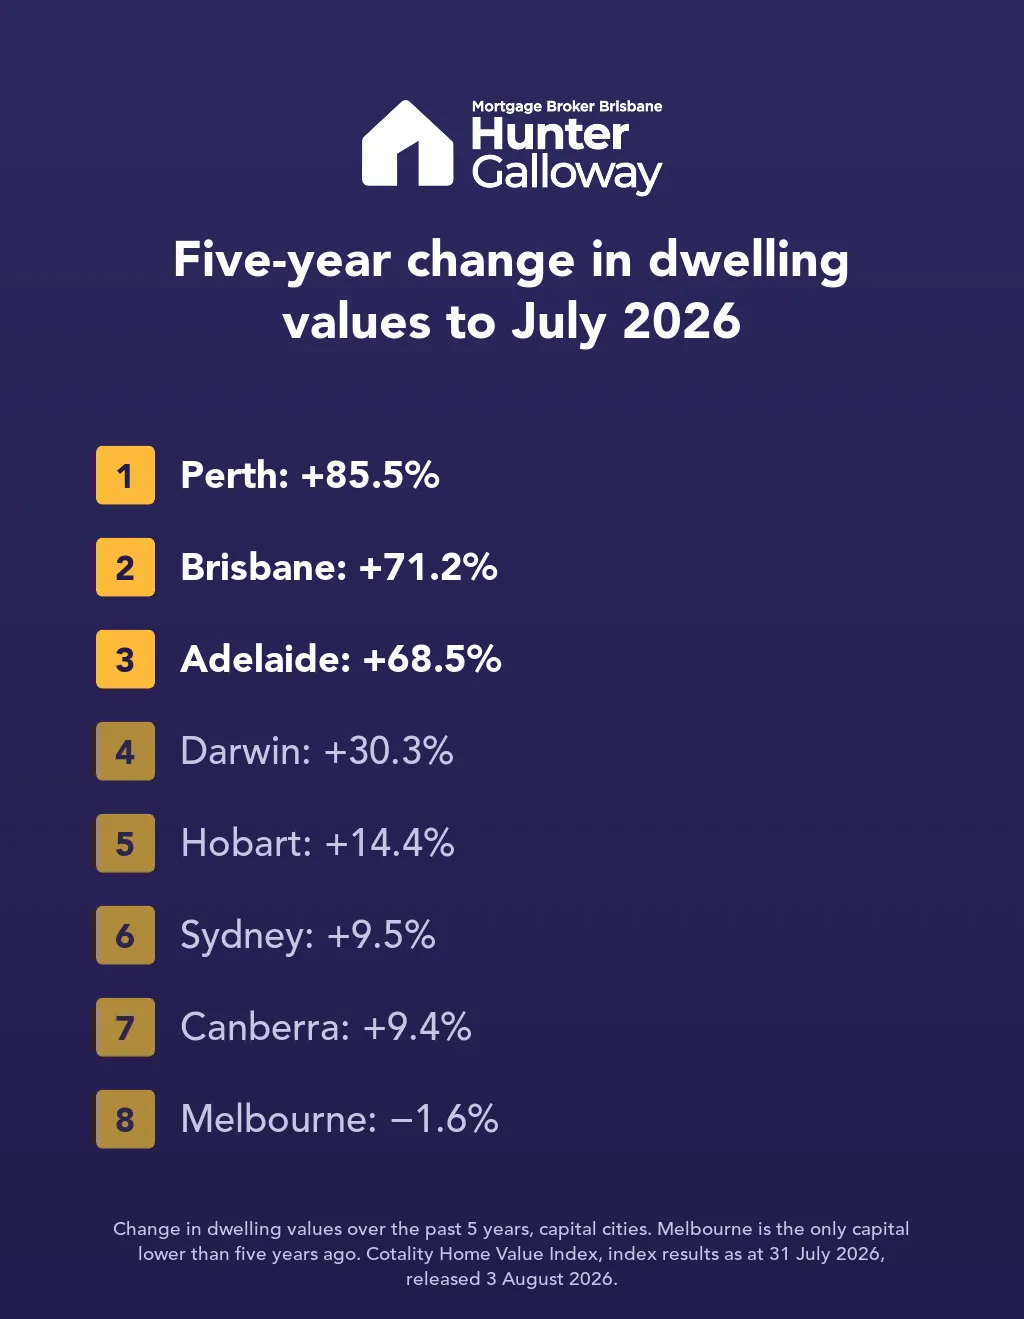
Historical, July 2026: five-year changes before the latest September data.
Read the historical July chart as a table
On smaller screens, scroll sideways to see every column.
| Capital | Five-year change |
|---|---|
| Sydney | +9.5% |
| Melbourne | -1.6% |
| Brisbane | +71.2% |
| Adelaide | +68.5% |
| Perth | +85.5% |
| Hobart | +14.4% |
| Darwin | +30.3% |
| Canberra | +9.4% |
Australian property prices have turned
National dwelling values were unchanged over the year to September 2026 after six monthly falls. Regional markets also weakened: the combined regional index fell 0.7% in September and 1.9% over the quarter, although it remained 5.6% higher over the year. Combined-capital values were 1.8% lower over the year.
For historical price context, the July 2026 Cotality release put the national median dwelling value at $928,421. That is a July figure, not an October valuation. The detailed city medians below are from the same July release. The July Cotality analysis is the source for that older comparison.
What’s pushing Australian property prices down?
Borrowing costs: the cash rate is higher after four increases in 2026. A buyer whose income has not changed can still find that their approved loan or comfortable repayment budget has changed. CBA also points to weaker sentiment and housing tax announcements as pressures on demand.
Longer-term demand and supply: population growth and the pace of new construction still matter, but they do not prevent prices falling when buyers have less to spend. Keep those longer-term considerations separate from the repayment and property checks needed for a purchase today.
What the earlier affordability figures tell us
Cotality’s November 2025 Housing Affordability Report put servicing a new loan at 45% of median household income and saving a 20% deposit at 11 years. It put the house value-to-income ratio at 8.9 times, compared with 6.6 five years earlier. These are historical national measures, not a calculation of your household’s position after the latest price and rate changes. A deposit scheme may reduce the cash needed upfront while leaving a larger loan to repay.
Mortgage costs and borrowing power
The June-quarter 2026 ABS Lending Indicators put the average new owner-occupier dwelling loan at about $731,000. That is a dated market comparison, not a borrowing target. Banks generally assess a new mortgage at a rate at least 3 percentage points above the loan rate, so a fresh assessment matters after rates change. Review unused credit-card limits and existing debts, then set a repayment you can sustain rather than borrowing automatically to the maximum. Our interest-rate outlook explains the latest bank forecasts.
Renting vs buying
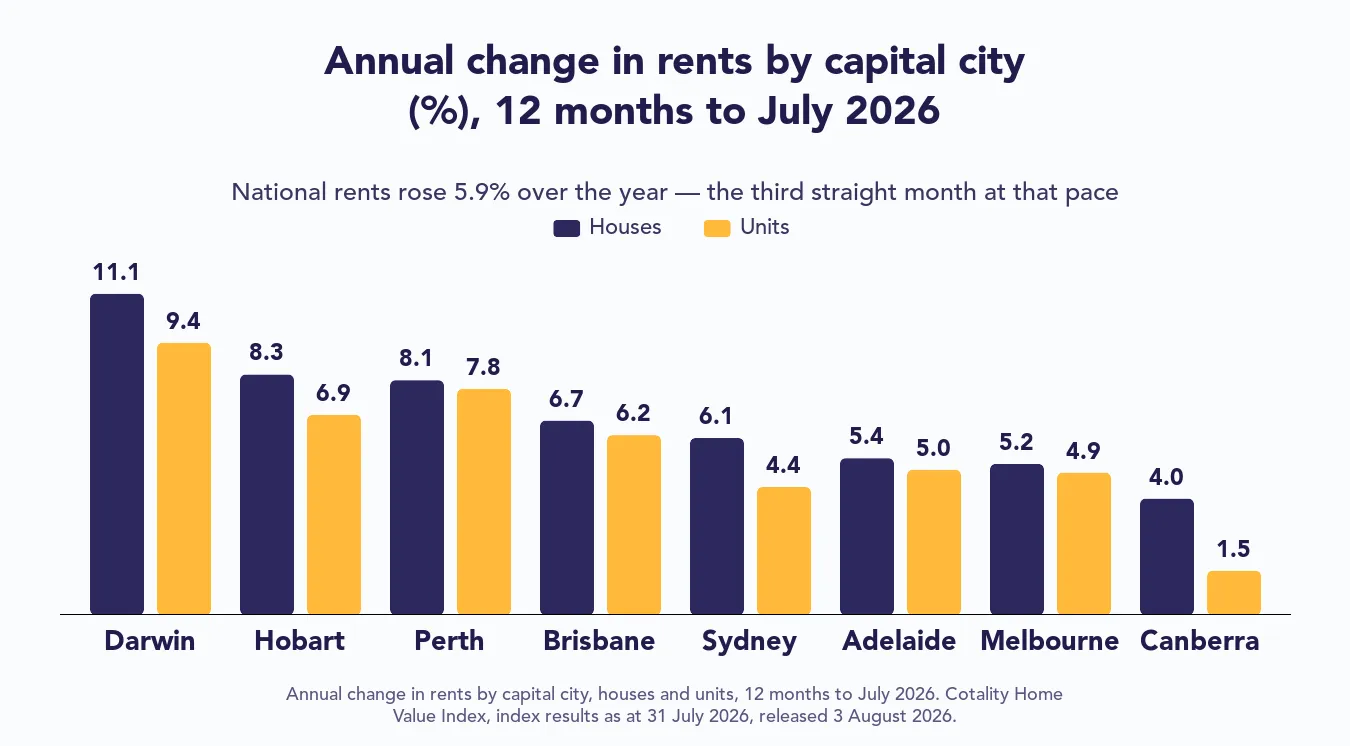
In the July 2026 Cotality release, national rents were 5.9% higher over the year and the vacancy rate was 1.7%. The earlier November 2025 affordability report put rent at 33.4% of household income. Those historical figures explain some of the pressure renters have faced; compare today’s rent with the full cost of owning, including loan repayments, rates, insurance and maintenance.
Historical, July 2026: annual changes in rents.
Read the historical July chart as a table
On smaller screens, scroll sideways to see every column.
| Capital | Houses | Units |
|---|---|---|
| Sydney | 6.1% | 4.4% |
| Melbourne | 5.2% | 4.9% |
| Brisbane | 6.7% | 6.2% |
| Adelaide | 5.4% | 5.0% |
| Perth | 8.1% | 7.8% |
| Hobart | 8.3% | 6.9% |
| Darwin | 11.1% | 9.4% |
| Canberra | 4.0% | 1.5% |
Sources: September index movements from Cotality, 1 October 2026; historical Cotality July 2026 and November 2025 affordability releases; ABS Lending Indicators, June quarter 2026.
Check to see if you are eligible for a home loan
How each capital city moved in September
The September movements below are from Cotality’s October Home Value Index report. The table shows Cotality median values at 31 July 2026. The city summaries below use September index movements.
On smaller screens, scroll sideways to see every column.
| City / region | July median dwelling | July median house | July median unit |
|---|---|---|---|
| Sydney | $1,244,617 | $1,529,308 | $889,617 |
| Brisbane | $1,104,094 | $1,207,039 | $875,135 |
| Perth | $1,029,797 | $1,073,500 | $760,708 |
| Adelaide | $944,909 | $1,007,684 | $692,861 |
| Canberra | $883,138 | $1,025,827 | $594,894 |
| Melbourne | $797,354 | $936,528 | $632,021 |
| Hobart | $756,951 | $805,165 | $587,863 |
| Darwin | $642,175 | $755,082 | $475,907 |
| Regional Australia | $769,867 | $786,438 | $675,011 |
Sydney
Sydney values fell 1.4% in September and 7.0% over the year. They were 8.6% below the February 2026 peak. If you are buying, use the extra choice to compare actual recent sales and keep your finance conditions in order. Our NSW stamp duty guide covers the separate upfront-cost question.
Melbourne
Melbourne values fell 0.7% in September and 6.2% over the year. A lower city median can make it worth comparing with other capitals, but the property’s condition, location and ownership costs still decide whether it suits your budget.
Brisbane
Brisbane fell 1.5% in September, the largest capital-city decline that month, but remained 5.9% higher over the year. That is a sizeable change from its earlier growth pace. Our Brisbane Property Market Update covers the local buying choices and checks.
Perth
Perth fell 1.2% in September while remaining 10.1% higher over the year. The strong annual result should not be read as proof that prices are still rising each month. Test your budget against current sales rather than an older growth forecast.
Adelaide
Adelaide fell 1.3% in September and remained 6.5% higher over the year. Compare recent local sales and the total cost of buying. Eligible buyers can also check our SA first home owners grant guide.
Canberra
Canberra values fell 1.1% in September and were 1.6% lower over the year, according to Cotality’s 1 October 2026 report. Use recent comparable sales for the area and property type you want.
Hobart
Hobart values fell 0.5% in September but remained 7.0% higher over the year. The annual gain and latest monthly fall describe different periods; neither tells you whether one listing is fairly priced.
Darwin
Darwin was the only capital to rise in September, up 0.4%, with annual growth of 11.9%. The July median in the table was the lowest capital-city median, but check current listings, insurance and the property itself before treating that as an affordable purchase.
Sources: September movements from Cotality’s October 2026 Home Value Index. Absolute medians in the table remain historical July 2026 Cotality figures. For current program eligibility and price caps, see our 5% Deposit Scheme guide.
What CBA expects for 2026 and 2027
CBA’s 1 October 2026 report forecasts a national peak-to-trough fall of about 9%, with prices stabilising and beginning to recover during 2027. That recovery depends on the RBA starting to cut rates next year. It is a conditional forecast, not a promise that prices or repayments will improve on that schedule.
On smaller screens, scroll sideways to see every column.
| Market | 2026 calendar-year forecast | 2027 calendar-year forecast | Peak-to-trough forecast |
|---|---|---|---|
| National | −6% | +2% | −9% |
| Five mainland state capitals | −7% | +2% | −10% |
| Sydney | −12% | +2% | −13% |
| Melbourne | −10% | +2% | −12% |
| Brisbane | −1% | +2% | −8% |
| Perth | 0% | +2% | −8% |
| Adelaide | −1% | +1% | −8% |
| Hobart | 0% | 0% | −7% |
| ACT | −7% | +2% | −9% |
| Darwin | +2% | −1% | −7% |
Source: CBA Economic Insights (client research note), 1 October 2026, dwelling-price forecast table. The national index, five-capital average and individual city forecasts cover different areas. Peak-to-trough declines cover the cycle and are not additional calendar-year falls.
For a buyer, I would use these forecasts to test the downside: could you still hold the home comfortably if its value fell or rate cuts took longer? A forecast cannot pick the right week to buy. The purchase needs to work with your current income and repayments.
Government help for first home buyers
Assistance can change the deposit and upfront costs, but eligibility, occupancy rules and local price limits need to be checked for the property you want.
Start with our 5% Deposit Scheme guide and Housing Australia’s first-home buyer website for the federal guarantee and Help to Buy programs. They work differently, so do not assume benefits can be added together.
The First Home Super Saver Scheme has its own contribution and release rules. Check these before signing a contract.
For state assistance, use our guides for buying in Queensland, NSW, WA and SA. We can then check the loan alongside the assistance you may qualify for.
Would you like to learn about your situation?
What to do before you make an offer
Start with a current borrowing-capacity check and a repayment you can manage. Our borrowing power calculator can help you begin, followed by a lender assessment using your actual figures.
Compare recent sales in your own area, including units and outer suburbs if they suit how you live. Softer prices can create room to negotiate, but do not give up property or contract checks to secure a discount. Get your pre-approval organised before making an offer.
If you already had finance lined up before the latest rate change, ask for it to be checked again. Speak with a mortgage broker about the purchase price, deposit, upfront costs and cash you want left after settlement.
Need help?
The Hunter Galloway team works with first-home buyers daily. We can help you:
- understand your borrowing capacity
- compare 30+ lenders
- prepare a pre-approval application
- position your offer competitively
Getting this groundwork sorted helps you make an offer with a clearer budget and fewer surprises.
Sources for this update
- APRA: mortgage serviceability buffer, 28 May 2026
- Cotality: September 2026 housing values, published 1 October, with detailed index tables.
- CBA Economic Insights (client research note), “Home prices fall further in September while credit growth holds steady in August”, 1 October 2026. Used for the bank’s forecasts and commentary.
- ABS: August 2026 Consumer Price Index, released 30 September
- RBA: 29 September 2026 decision and cash-rate effective dates
- Cotality: original July 2026 historical comparison and July chart figures and tables
General information only. This doesn't consider your objectives, financial situation or needs. Rates, policies and figures change, so confirm current details before acting. Loans are subject to lender approval.